I posted earlier about an experiment with virtual daylighting on a small scale using indirect light.
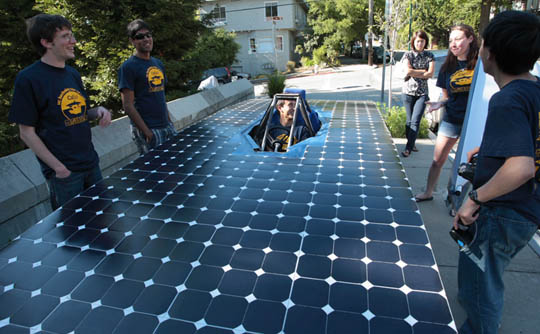
Here is a post about a direct experiment where the designer replicates the sky, clouds and all, using arrays of LEDs.
Probably not an energy efficient use of LEDs but an interesting experiment that requires some thought about the trade-offs between energy efficiency and productivity gains.
I can't make a good decision about how to make my energy usage sustainable unless I know which activities are using the most energy. The chart presented here attempts to give an idea of the scales of energy I've been talking about in previous blog posts.
The total energy usage in the US per year (as noted in this blog post) is ~1x10^20J. For comparison, that is:
Closer to home, the total electricity used per year by the average US household is about 4x10^10J. While media focus has been on making our homes more energy efficient as a good way to tackle sustainability, it turns out that driving a single car each year uses ~5x more energy than our homes consume*. Increasing fuel efficiency or reducing miles driven by 20% would be the equivalent of reducing your home electricity usage by 100%. That's big leverage. Better than caulk or fluorescent light bulbs.
Flying is also pretty energy intensive. A single flight from SanFrancisco to Tokyo uses about the same energy as driving a car for a year** or ~3.5x the average annual electricity usage of a home. With about 4 flights per day 365 days/yr that is ~5100x the average annual electricity usage of a home per year of flights... and that's just one destination from one airport...
So shooting for 30% reductions in energy usage in the home may not be entirely where the leverage lies.
Lawrence Livermore National Labs published a very interesting diagram of energy usage in the US for 2009 (above picture).
One thing to take away from it is that most of the inefficiencies ("rejected energy") come from:
transportation (37%)
losses during electricity generation (48%)
Combined commercial and residential losses amount to about only 7%.
So even if I could make all commercial buildings and houses 30% more efficient through energy efficiency retrofits, new appliances, smart monitoring, lighting and HVAC feedback controls, etc, that would only reduce the rejected energy by 2%.
Leverage comes from addressing transportation and energy generation and transmission.
Electric Cars:
LLNL assumes 25% efficiency for conversion of petroleum energy to useful transportation energy. If you assume that electrifying all transportation could improve this to 90%, that would reduce rejected energy by 24%. That's 12x the impact of green building on energy usage.
Distributed Generation: Solar panels and wind in your backyard.
Transmission losses are estimated at about 6.5% for 2007. If those losses were eliminated (optimistically) by putting solar panels and wind farms near the consumers, that would reduce rejected energy by ~1.5%, or slightly less than making all buildings "green" with respect to their energy usage.
A much bigger deal is the reduction in fossil fuel usage this would allow. Assuming that wind, hydro, geothermal, nuclear and solar are 100% "efficient"(no rejected energy), that means fossil fuels are only about 24% efficient. If you could replace all the coal with some combination of these other sources (preferably wind or solar to allow for distributed generation), that would reduce rejected energy by ~25%. That's 12x the impact of green building (albeit at potentially high cost).
This is not to say that green building is unimportant but, if this analysis is correct (or even in the ballpark), then it's far less important in the big picture of energy efficiency than I thought.
It is important to concede that the changing all transportation to electric drive and replacing all coal with solar or wind is a HUGE hurdle to overcome. Making buildings greener may not be the longest lever but it's one that is easier to deal with.
To allow for a full trip home would take ~12 hrs of recharge time or
A panel that could generate ~0.9kW and be ~86 ft^2. That's more than 1.5x the area available on the car roof.
To give a sense of the size of the problem of solar charging exclusively:
To fully charge the battery would take ~73 hoursor
A panel that could generate 5.2 kW and be ~519 ft^2. That's more than 9x the area available on the car roof.
Most houses that get solar PV only go for 2 - 3 kW.
So self powered cars ALMOST make sense as long as you can recharge them from the grid after you get home. Fully self powered solar cars don't make sense.
It also strongly suggests that solar powered EV recharging stations (e.g. with the panels on a nearby roof or on the parking lot roof) actually make quite a bit sense.
What are the two main things you worry about with electric cars?
Price
Range
Gasoline is great because it is a well established, subsidized fuel with very high energy density (1.3x10^8 J//kg). That makes it easy to carry around and get pretty far with. Plus, when you run out, there's always a gas station somewhere nearby. Price and range... not a problem.
Electric cars are limited by their batteries. Li-Ion battery's energy density is nowhere near as high as gasoline (5.2x10^5 - 7.2x10^5 J/kg - gasoline has >180 times more energy per kg of "fuel"). Even accepting that a gasoline engine is 30% efficient vs a 90% efficient electric motor (i.e. total energy that would be converted to work per kg of fuel is 3.9x10^7 J/kg for gasoline vs 6.5x10^5 J/kg for Li-ion), that yields ~60 times more energy per kg of "fuel" from gasoline than from batteries. So to get the same range as a gasoline car (from one tank of fuel), requires either:
A very large battery -or-
If a typical car holds 15 gal of gasoline (@ ~2.7kg/gal = 40.5 kg) , a battery that contains the same effective energy would need to weigh ~2430kg ... where a Honda Civic weighs about 1270 kg... not practical to carry or to pay for.
The ability to "refuel" the battery in less time than refueling a car
Even with the best recharger possible, it takes hours (~4 hrs for a Tesla roadster) vs maybe 5 minutes to refill a gas tank.
With a 100 mile range per battery charge, that would require about 4 battery charges per tank of gas (assuming CAFE standard of 27.5 mpg and 15 gal tank = 412 mile range). Sixteen hours (battery) vs 5 minutes(gasoline) (assuming both cars start empty).
Those are pretty bad starting places to catch up from.
So Shai Agassi has an idea: Treat the electric car like a cell phone.
The customer buys miles and gets a subsidized car. The batteries are the medium for the "minutes." You never own them, you just use them.
Which means you can now swap batteries because you don't care about the specific battery that you have, only that you're getting the mileage you're paying for. Suddenly the range problem goes away (~1min to change the battery). Suddenly the price has a means of being subsidized (ala cell phone contracts that keep the price of the phone low for the end user).
Bike to work and stop global warming.
Bike to work and get healthy.
Ok. Since it's so good for me and my planet and I'm only about 6 miles from work, I finally decided that I should give this a try.
I used a cool iPhone app (Runkeeper) to log how far I went and how fast I went there. As part of the app I got an estimated calorie usage... and that got me thinking about energy efficiency:
I burn about 240 calories one way on this trip (~6 miles).
My Prius, on roughly this same route, gets around 42 mpg (I'm a terrible hypermiler). So it takes around 0.14 gal of gas to make the trip, or1.8x10^7 J (~18.6 MJ).
So my bicycle commute is more than 18 times more energy efficient than driving.
...And I drive a Prius.
If you use the CAFE Standard fuel efficiency for a passenger car in 2010 (27.5 mpg), then that bicycle commute is more than 28 times more energy efficient than driving.
To be as energy efficient as cycling, the car would need to use 0.01gal of gas for the 6 mile trip, which is 600 mpg! Whereas the current automotive X-Prize is only looking for 100 mpg... 6x short of what is needed.
So we REALLY need to be doing more of what Copenhagen is doing with making cycling mainstream:
"If you make the bicycle the fastest way to get around the city ... you're going to get everyone and their dog to do it."
Pervasive use of dedicated bicycle lanes.
37% of all people commuting to work or school use bicycles.
50% of all trips in the city are made by bicycle.
Double bike lanes to accommodate bike traffic volume in some places.
"Green wave" timed to give cyclists a no-stoplight flow into the center of the city for 6km (3.7mi).
Red LED lights on the bicycle lane demarcation that sense coming bicycles and flash to warn cars to avoid right turn conflicts.
Dedicated parking spots for cargo bikes (taking away 1 car parking spot for 4 cargo bike spots).
An overview of how to approach the problem (7 steps)
Estimate baseline energy use intensity.
Commission an energy audit.
Consider interactions between systems.
Perform financial analysis of possible efficiency investments.
Prioritize options for investment.
Evaluate financing options.
Post-implementation follow up.
Tips for identifying and overcoming common barriers to implementing energy efficiency
Structural
Split incentives - one who bears cost of improvements does not accrue benefits
short lease terms - payback period is longer than least term
Organizational
Scarce resources
“Language barriers” between finance and facilities
Coordination challenges across finance, human resources and facilities
Limited accountability for green initiatives
Financial
Payback period expectations are unrealistically short
Large up-front costs to implement some improvements
lack of awareness of tax incentives or utility subsidies
Simple, practical suggestions for which systems to look at first (lowest cost for highest impact)
Which systems exist and which you should go after first
Lighting
HVAC
Office equipment
Water heaters
Building Automation Systems / Energy Management Systems
Data centers
Fleet vehicles
Which areas to focus on and which to skip within each system
Behavioral and policy changes
Retrofits
Equipment replacement
Tips on prioritizing which improvements to make
Key questions to ask and information to gather around each system
Case studies to help justify implementing changes in any particular area.
e.g. Financial case study: Until 2001, the 1.4-million-square-foot Hewlett Packard (HP) campus in Roseville, California, was operating an EMS with limited automation, which required labor-intensive manual adjustment of controls in order to curtail energy loads during peak demand events. Using funds available from the California Energy Commission and the local municipal utility (Roseville Electric), HP upgraded its EMS and added additional sensor and control points for ventilation and lighting systems. The changes gave HP the capability to shed 1.5 MW of its 10.9 MW peak demand without disrupting occupants. HP now uses the EMS load-shedding capabilities on a day-to-day basis, saving $1.5 million annually in energy costs as a result. The EMS upgrade cost $275,000, but incentives covered $212,000 of the project cost, giving HPa payback of less than one month on the project.6
Ideas for presenting financial and non-financial arguments to the appropriate stakeholders in the organization.
High level primers and key-word dictionaries on main building systems and links to more information about them to help focus one's learning.
From the previous post, one could conclude that LEDs, Fluorescents and Metal Halide HIDs were all pretty much the same: High efficacy, OK to good CRI and good color temperatures.
Yet what we see are fluorescent bulbs everywhere.
One way to compare these light sources is by bulb life vs cost per lumen output with efficacy taken into account. That looks like this: "Good" is high and to the left with a larger bubble.
One conclusion that immediately stands out is how expensive LED lights are relative to the alternatives. They may be 2x as efficient and last 5x as long, but they are ~38x - 175x the price. That makes adoption of LEDs very difficult for most applications that don't have some other needs specifically met by LEDs.
LED lighting is more easily controlled (dimmable) to allow for controllability of systems - lighting (EQ6.1).
Flicker
For some tasks and working conditions, 60Hz cycling from fluorescents can cause eye strain, especially if it is used with other visual equipment that runs off 60Hz AC. LED lighting has a 120Hz cycling which means it is much more difficult to detect flicker and it is less likely to beat with other equipment running at 60Hz.
Dimming
Commercial use fluorescent bulbs (T8, T10 and T12) are not easily dimmable due to the construction of the ballast that keeps them lit. LEDs are dimmable using standard dimming equipment. This is important for applications where light level control is desired.
Directionality
LEDs are point sources that can be configured more easily to provide a variety of lighting patterns (focused to diffuse) while fluorescent bulbs are generally quite long making it more difficult to use as task lighting or for other special lighting purposes.
Toxic waste disposal concerns
Fluorescent bulbs contain mercury which is a hazardous substance. LEDs do not contain mercury, though they are still eWaste and need special handling for disposal.
Low temperature operation
LED lighting performs better at lower temperatures. In fact, life time if greatly reduced if they operate at too high temperatures (hence all the heat sinks on the LED bulbs). This makes LED lighting a natural fit for lighting refrigerated displays.
Green image
The current perception of LED lighting is that it is the next big thing in energy efficiency and is, therefore, green. Using this perception to advertise your greenness is good marketing.
While Metal Halide HID compares well on the cost/lm vs lifetime graph, it does have a major strike against it, besides the borderline CRI: restrike time. This is the time it takes for the bulb's arc tube to cool sufficiently to restart the plasma. This can be several (1 - 15) minutes. A long restrike time makes such bulbs very difficult to use in locations where individual light control is required (e.g. office spaces or residential). Using fast starting HIDs greatly shortens the life of the bulb.
So as the cost of LEDs drop (cost comes in line with alternatives), energy costs rise (efficacy difference becomes more important) and green building codes become more prevalent (raising the minimum energy efficiency requirements for new buildings), the ROI of LED lighting will rise vs fluorescents until LED lighting makes economic sense.
Photometry: The science of radiated energy as observed by the human eye. Metrics of photometry incorporate wavelength and sensitivity of the human eye at various wavelengths (luminosity function).
vs Radiometry, which is the science of radiated energy without regard to human perception of the radiated energy.
Luminous Intensity: measured in Candela (cd). Defined as:
The luminous intensity, in a given direction, of a source that emits monochromatic radiation of frequency 540 × 1012hertz (~550 nm) and that has a radiant intensity in that direction of 1⁄683 watt per steradian
Luminous Flux: measured in Lumens (lm). The light produced by a light source that emits one candela of luminous intensity over a solid angle of one steradian. Light bulbs usually label the output of the bulb in Lumens somewhere on the package.
Illuminance: measured in Lux (lx) or Foot Candles (fc). The total luminous flux incident on a surface, per unit area.
For metric units: Lux = lm/m^2
For English units: Foot Candles = lm/ft^2
How light sources are characterized:
Efficacy: The amount of illuminance generated per watt of energy input.
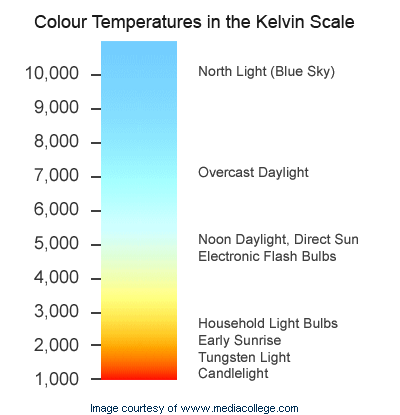
Color Temperature (CT) / Correlated Color Temperature (CCT): The "whiteness" of light generated from a source. Correlated to the color of light produced by a radiating black body of that temperature (K).
Color Rendering Index (CRI): The ability of a light source to correctly reflect accurate colors in the environment. CRI = 100 is perfect reproduction. CRIs in the range of 75-100 are considered excellent, while 65-75 are good. The range of 55-65 is fair, and 0-55 is poor.
I plotted the source characteristics for some common light sources below to show how they relate to each other. "Good" translates to high, to the right(ish) and with a large sized bubble.
What does that mean?
Incandescent and halogen bulbs are what most homes use today so they are the baseline against which all other lighting is most easily compared.
It has good CRI, medium-low CT and very low efficacy.
i.e. objects appear to be the "right" color when illuminated and the light itself is "warm (reddish)" but takes significant energy to produce very much of.
Fluorescent lights are very common, particularly in commercial lighting and are the other light source which you've probably encountered frequently. There is large variation in the characteristics available depending on phosphors used but:
Newer bulb types have reasonably good CRI, a wide range of CCTs (med - high) and high efficacy.
i.e. objects appear to be nearly the right color, light can be anywhere from "warm" to "cool (white)" (depending on the bulb) and energy is efficiently converted to light (~5x incandescent).
Metal Halide High Intensity Discharge (HID) are more common as outdoor lighting (and a variant - Xenon HID in car headlights).
It has borderline good CRI, medium CT and high efficacy.
i.e. objects appear to be the "almost right" color when illuminated, the light itself is "cool (white)" and energy is efficiently converted to light (~7x incandescent).
Low Pressure Sodium lighting is the the yellow street lamp you've probably seen in the parking lot that made it impossible to figure out which car was yours because they all looked grey.
It's very good at converting energy to light, but it's not light you want to look at... unless you are an astronomer and want to filter out the city of San Jose's light pollution from your observations...
LED lighting is still fairly rare but is starting to show up in some more efficient building designs, vending machines and refrigerated display cases.
Newer LED types have reasonably good CRI, a wide range of CCTs (med - high) and high efficacy.
i.e. objects appear to be nearly the right color, light can be anywhere from "warm" to "cool (white)" (depending on the phosphor used) and energy is efficiently converted to light (~10x incandescent).
Conclusion: modern fluorescents are quite good from a light quality standpoint, modern LEDs are similar as are (some) HID lamps. LEDs are clearly more "efficient" but adoption is still low. From this basic data one would expect that HID penetration would be higher too. Why is it not?
I'll get into more characteristics of these light sources later to better understand why the lighting situation looks like it does today, but hopefully this post went a good way towards explaining why the forerunners are what they are.
This story from Treehugger highlights an interesting quantification of the BP Oil Spill in terms of energy being wasted.
The estimated cost to clean up the oil spill ($40 B)is many times greater than the cost to retrofit 75,000 houses ($1 B) and save the energy equivalent of the gulf oil spill every year.
75,000 houses = mid-sized U.S. city or large suburb of a major city, like Chattanooga, Tenn. or Providence, R.I.
A typical home energy retrofit costs around $10,000 per house -- before any utility or governments energy rebates are applied.
Of course, wasted energy is only a small part of the problem. There is the matter of millions of barrels (>114 million gallons = ~2.7 million barrels in worst case estimate or ~30M gal for a more conservative estimate) of crude oil in the water:
Oil washing up in coastal habitats killing animals, destroying ecosystems and heading towards Florida and the Atlantic Ocean.
Tons (>1.2 Million gal) of toxic chemicals being sprayed on it (dispersants) with unknown long term impact
The effect of the dispersed oil droplets sinking in the water column impacting sub-surface life.
Increased hyopxic "dead zone" in the gulf (between 8% and 30% larger than normal) possibly from all the methane being pumped into the water along with the oil, further impacting the ecosystem.
The short and long term cost of health effects from the oil, chemical and gas exposure on clean up volunteers.
The resulting economic and job loss throughout the market chain as people cannot catch fish, sell fish, buy fish, so fishermen can't buy things thereby hurting local businesses which rely on the fishermen's income. (1% of Lousiana's economic output according to NPR)
More economic loss from the moratorium on deep water drilling (16% of the economic activity of Louisiana according to NPR).
The loss in stock value of BP impacting the retirement income and viability of retirement portfolios for large numbers of people, bringing further economic hardship on people already in the middle of one of the worst recessions in recent history.
So interesting comparison: yes... but sort of missing the big picture.
In this story from MIT Tech Review:
A team has shown that they can generate power (~6.5uW) from a fuel cell embedded in the tissue of a rat. The fuel cell uses glucose from the bloodstream to generate power.
A pacemaker requires ~10uW of power to run so this is not quite ready for prime time but it suggests an approach that makes embedded medical devices much easier to live with (no external battery packs or replacement needed).
In a previous post I wrote a bit about wireless mesh networks as a means to cost effectively retrofit sensors into a building to allow feedback control and continuous monitoring of environmental conditions to reduce energy usage.
One problem with wireless: batteries.
While they may last for years, they do need to be replaced eventually. If you have truly adopted a full building installation of sensors, that would be hundreds of nodes and batteries tucked into all kinds of hard to access locations where the HVAC, power distribution, and other systems are located or routed.
Replacing all those batteries in all those places: not trivial.
Energy scavenging to the rescue!
Using versions of the technology that power your kinetic watch (mechanical micro-generators) or that can be stuffed into a shoe (piezoelectric), enough power can be generated from ambient vibrations to power the sensors. It's not a lot of energy, but it's probably enough for low power network devices:
Energy required is, therefore ~7.9 mJ per minute (for 48ms transmissions).
Micro-mechanical energy generators produce on the order of a few (1-5-ish... say 2) mW of power. This could yield up to ~120 mJ of energy per minute (depending on the consistency of vibrations).
So, even with a smaller or less efficient generator than I found in a few minutes of searching, with a small battery or capacitor to store the micro-generator's energy you're in business without battery changes.
In my last post, I came up with a bad model for an energy dashboard business based on annuities paid by the utilities companies for energy saved. However, there did seem to be a bright spot for selling the dashboards to the utilities to install themselves. Looking at that a little more closely...
If you add that to the ~$35.6/customer savings in direct generation costs, that is ~$37/customer*yr.
So if a utility is willing to accept a 3 year pay back period, then each installation could cost up to ~$111, for a TAM of around $1.4B for serving all of CA.
Not too bad as long as you have an alternative revenue stream planned for after the initial sale (e.g. s/w license fees for maintaining the dashboard customer feedback, data aggregation, reporting, etc).
The utilities' ROI increases the more effective the actual energy savings and the less expensive the installation. So to compete here you'd need to prove that your system will create and maintain better energy reduction outcomes per $ of installed equipment. If you could do it all in s/w leveraging customer's existing h/w or without any installed h/w, that would be the best.
In a previous post, I wrote a bit about why so many smart grid cleantech companies were focusing their efforts on utilities instead of consumers: the power of big numbers leverages small efficiencies into large $ amounts.
With that knowledge, what kind of business could I build around selling energy dashboards to the utilities?
A few assumptions, some of which are probably pretty optimistic just to simplify things without really changing the conclusion (I hope):
I want to run a business based on annuities (utilities pay me a "subscription") rather than hardware and s/w services (utilities buy my h/w and s/w directly).
I manage to get 100% of electric utilities in CA to put my product in 100% of customers' buildings [~12.9M customers]
The utilities agree to pay me 50% of the saved costs of generation [~$17.82/customer*yr]
A customer dashboard costs my business $35 installed.
I take out 15% profit and have 10% overhead costs to run finance, HR, facilities, etc.
35% of my workforce is engineering or other functions not directly customer facing / supporting.
It costs $200k/yr to hire, compensate and retain each employee on average.
Two key numbers come out of this:
$453M - The cost to install the equipment at all the customers' locations. That's serious start up capital or a very slow ramp of the business. Starting isn't going to be easy.
23,000 - The number of customers per non-engineering employee that would have to be supported assuming I could start the company, pay off my debt and get to a steady state. If I'm paid actual savings, that means I need to get all the customers to actively use their dashboards and change behavior. The challenge of getting a diverse population (the state of CA) to sustainably change behavior over time with such a ratio is staggering.
As of that weren't enough, it would make sense for the power utility to shift their baseline over time rather than pay me for the same level of performance forever as it would be cheaper to address the problem themselves. This means that I'd not only have to get people to achieve good energy savings (target 10% on average - per the previous post), I'd have to increase this over time to avoid going out of business or avoid drastically shrinking the business.
I think I can throw this business plan out as a case where annuities are a bad business model.
However, that $453M number does suggest that selling h/w and analysis / customer feedback infrastructure to the utilities might be a better way to go. Maybe I could even write a game to make engagement fun.
A couple of masterful examples of people really digging into the details of energy usage and what that MEANS in the context of things we can understand and visualize.
This, from the O'Reilly Emerging Technology Conference, San Diego, CA, March 4, 2008, by Saul Griffith, is long but great:
This, by Catherine Mohr, is much shorter but very educational:
Ok... not smoking per-se, but the 12V plug they built into every car to run the cigarette lighter.
Many of the electronic items in the home do not require 110V AC. If it has a big plug adapter or a power brick attached, the item is converting the 110V AC down to some smaller (something around 5 - 12V) DC current. Those conversions are not perfect and energy is lost.
What if you recovered those losses by having a single efficient conversion instead of many less efficient ones (or required that all converters be more efficient)?
Assuming that computer power supplies are representative of overall power supply conversion efficiencies, the average AC/DC converter is about 75% efficient. On the upper end, you can get ~90% efficient converters. So say a 15% difference in conversion efficiency between several average converters and one efficient one.
According to the DOE End Use Consumption of Electricity Survey (2001 - latest data), about 15% of a house hold's electricity usage goes to things that could, plausibly, run on 12V DC power. That was about 173.5 Million MWh of electricity. Improve that by 15% and you save 26 Million MWh of power.
The average output of a coal fired power plant is about 233 MW. So, for simplicity, if you assume 100% duty cycle, that 15% efficiency boost becomes the equivalent of 12.7 coal fired power plants.
While that is maybe not world saving (<1% of the 1445 coal fired plants in operation in 2008), that is ~5.5x the total Solar (thermal + PV) generating capacity in 2008... a bigger impact than solar has gotten us so far.
Where DC wiring, rather than just more efficient converters, might be more important is in Solar PV on homes. In that case, the DC output of the panel is converted to AC before being used in the home. That step has about a 90% efficiency.
However, many appliances then convert the AC right back to DC with all the losses noted above. Even with 90% efficient converters, that's a 19% efficiency loss over using the electricity directly from the panels.
Viewed another way, the AC wiring in your house is raising the price of Solar PV by almost 20%!
In the last post, I used a system diagram to look at a picture of sustainability leverage points from the perspective of the owner. That can be turned around and used to look at the picture from the perspective of a cleantech vendor. Let's say someone like Redwood Systems who makes an LED lighting + sensor system that allows feedback to a building automation system.
Key messages can be tailored to the exact circumstances and interests of the building owner but two main themes seem to stand out around energy usage and environmental quality.
Reduced energy usage:
drives down operating costs
Direct savings from the lower energy consumption of the lighting fixtures.
Indirect savings from the improved efficiency with which the fixtures, HVAC and process equipment can be operated based on feedback that the fine grained sensor network provides.
helps the planet and, thereby, your operating risks / costs
Reduced energy usage lowers the company's carbon footprint, reducing its impact on the environment.
A reduced carbon footprint, in addition to helping reduce the potential business continuity costs and impacts of climate change, also helps reduce potential liability for carbon tax or cap & trade costs.
Better control of environmental quality:
improves productivity and profits
Fine grained feedback control over the workspace allows for a more pleasant and, therefore, productive workplace. Even small increases in productivity provide large leverage when weighed against total payroll costs, especially for highly paid, specialized workers.
improves worker retention
Deployed as part of a larger program for improved retention, having a comfortable workspace with a customizable, controllable environment decreases costs of turnover both in lost productivity and in direct training.
Require or could benefit from some sort of real time or on-going monitoring
Could use a portable monitoring system comprised of sensors and small data network.
Address the toxicity and recycle-ability of the sensor & networking systems
You find that something on the order of half of the credits (around 46 of 92 when I last checked) could be affected by having a good sensor system available.
Sensors, of course, need a communication network to feed their data back to a building automation system, (BAS) or building management system (BMS). If you are forward thinking and lucky enough to be engaged in new construction, then you can build many of these networks into the plan. Then when you meet the USGBC requirement for ongoing performance monitoring by following the EB:O&M certification route, you will be ready. For new construction, this is probably a good way to go.
However, if you're in the position of having an already complete building and you want to obtain EB:O&M, getting such a network in place could cost a considerable sum due to the wire routing involved. In such cases, using a low power wireless network would be preferable. Given the large area to be covered by a wireless sensor network and the large number of discrete sensors needed, this kind of application lends itself to a wireless mesh network (ala IEEE 802.15). Basically a network that uses the nodes to communicate with each other rather than requiring all units to communicate with a central access point. The more nodes (sensors) in place, the better the network becomes... and it's low power enough to run on batteries for months at a time... important if you need to pay someone to replace all those batteries.
UC Berkeley has pioneered work on this topic, coining the phrase "smart dust," and spun off at least one company (Archrock) that aims to address this kind of market space.
A quick survey of a handful of smart grid tech companies who are creating devices for consumer use shows that they are mostly targeting the utilities rather than the consumers (home owners). Why?
Looking at the numbers I've come up with, it's clear that this is a game of very large numbers. Small percentages of large numbers are still large numbers. So you need a customer who can leverage those very large numbers.
The consumers cannot.
The utilities can.
The combined generators of power in CA would see a $461M/yr savings.
It's hard to get a home owner excited about $80/yr.
It's probably a little easier to get a utility interested in a few hundred million $ per year
... and this doesn't include planning for Cap & Trade...
Corporate income tax revenues are projected to be ~$179B. Only ~26% of what you'd need.
The only other two income line items of equivalent magnitude are:
Personal income taxes (~$1051B)
Social Security payroll taxes (~$683B)
Looked at another way: If you spent the ENTIRE GDP of the US (~$14Trillion) at trying to replace the entire energy usage of the US (3297TWh) with solar PV, it would take ~7.9 months of spending (65% of GDP).
To put this number in perspective, the US Military Budget is 4.8% of GDP. That's ~17 days of spending.
Not that it's realistic or even correct, but can you imagine the entire US economic output focused on nothing but solar for almost 2/3 of a year?